User guide
PrankWeb is a web-based application that allows to predict and visualize protein-ligand binding sites. Furthermore, it allows to compare the location of predicted pockets with highly conserved areas as well as actual ligand binding sites. All one needs to use PrankWeb is a device with a web-browser that supports WebGL.
Quick start
To skip to the detailed description of the application, click here.
Structure selection
The user can specify what protein to analyze in three ways:
- PDB code (Experimental structure)
- Upload a structure file (.pdb, .cif) with selected chains (Custom structure)
- Uniprot ID (Predicted structure)
The user may also specify whether to use evolutionary conservation in the prediction model. This makes the analysis slower, but more accurate. The conservation score calculated represents protein similarity to other proteins in the same family. More information available below.
Visualization
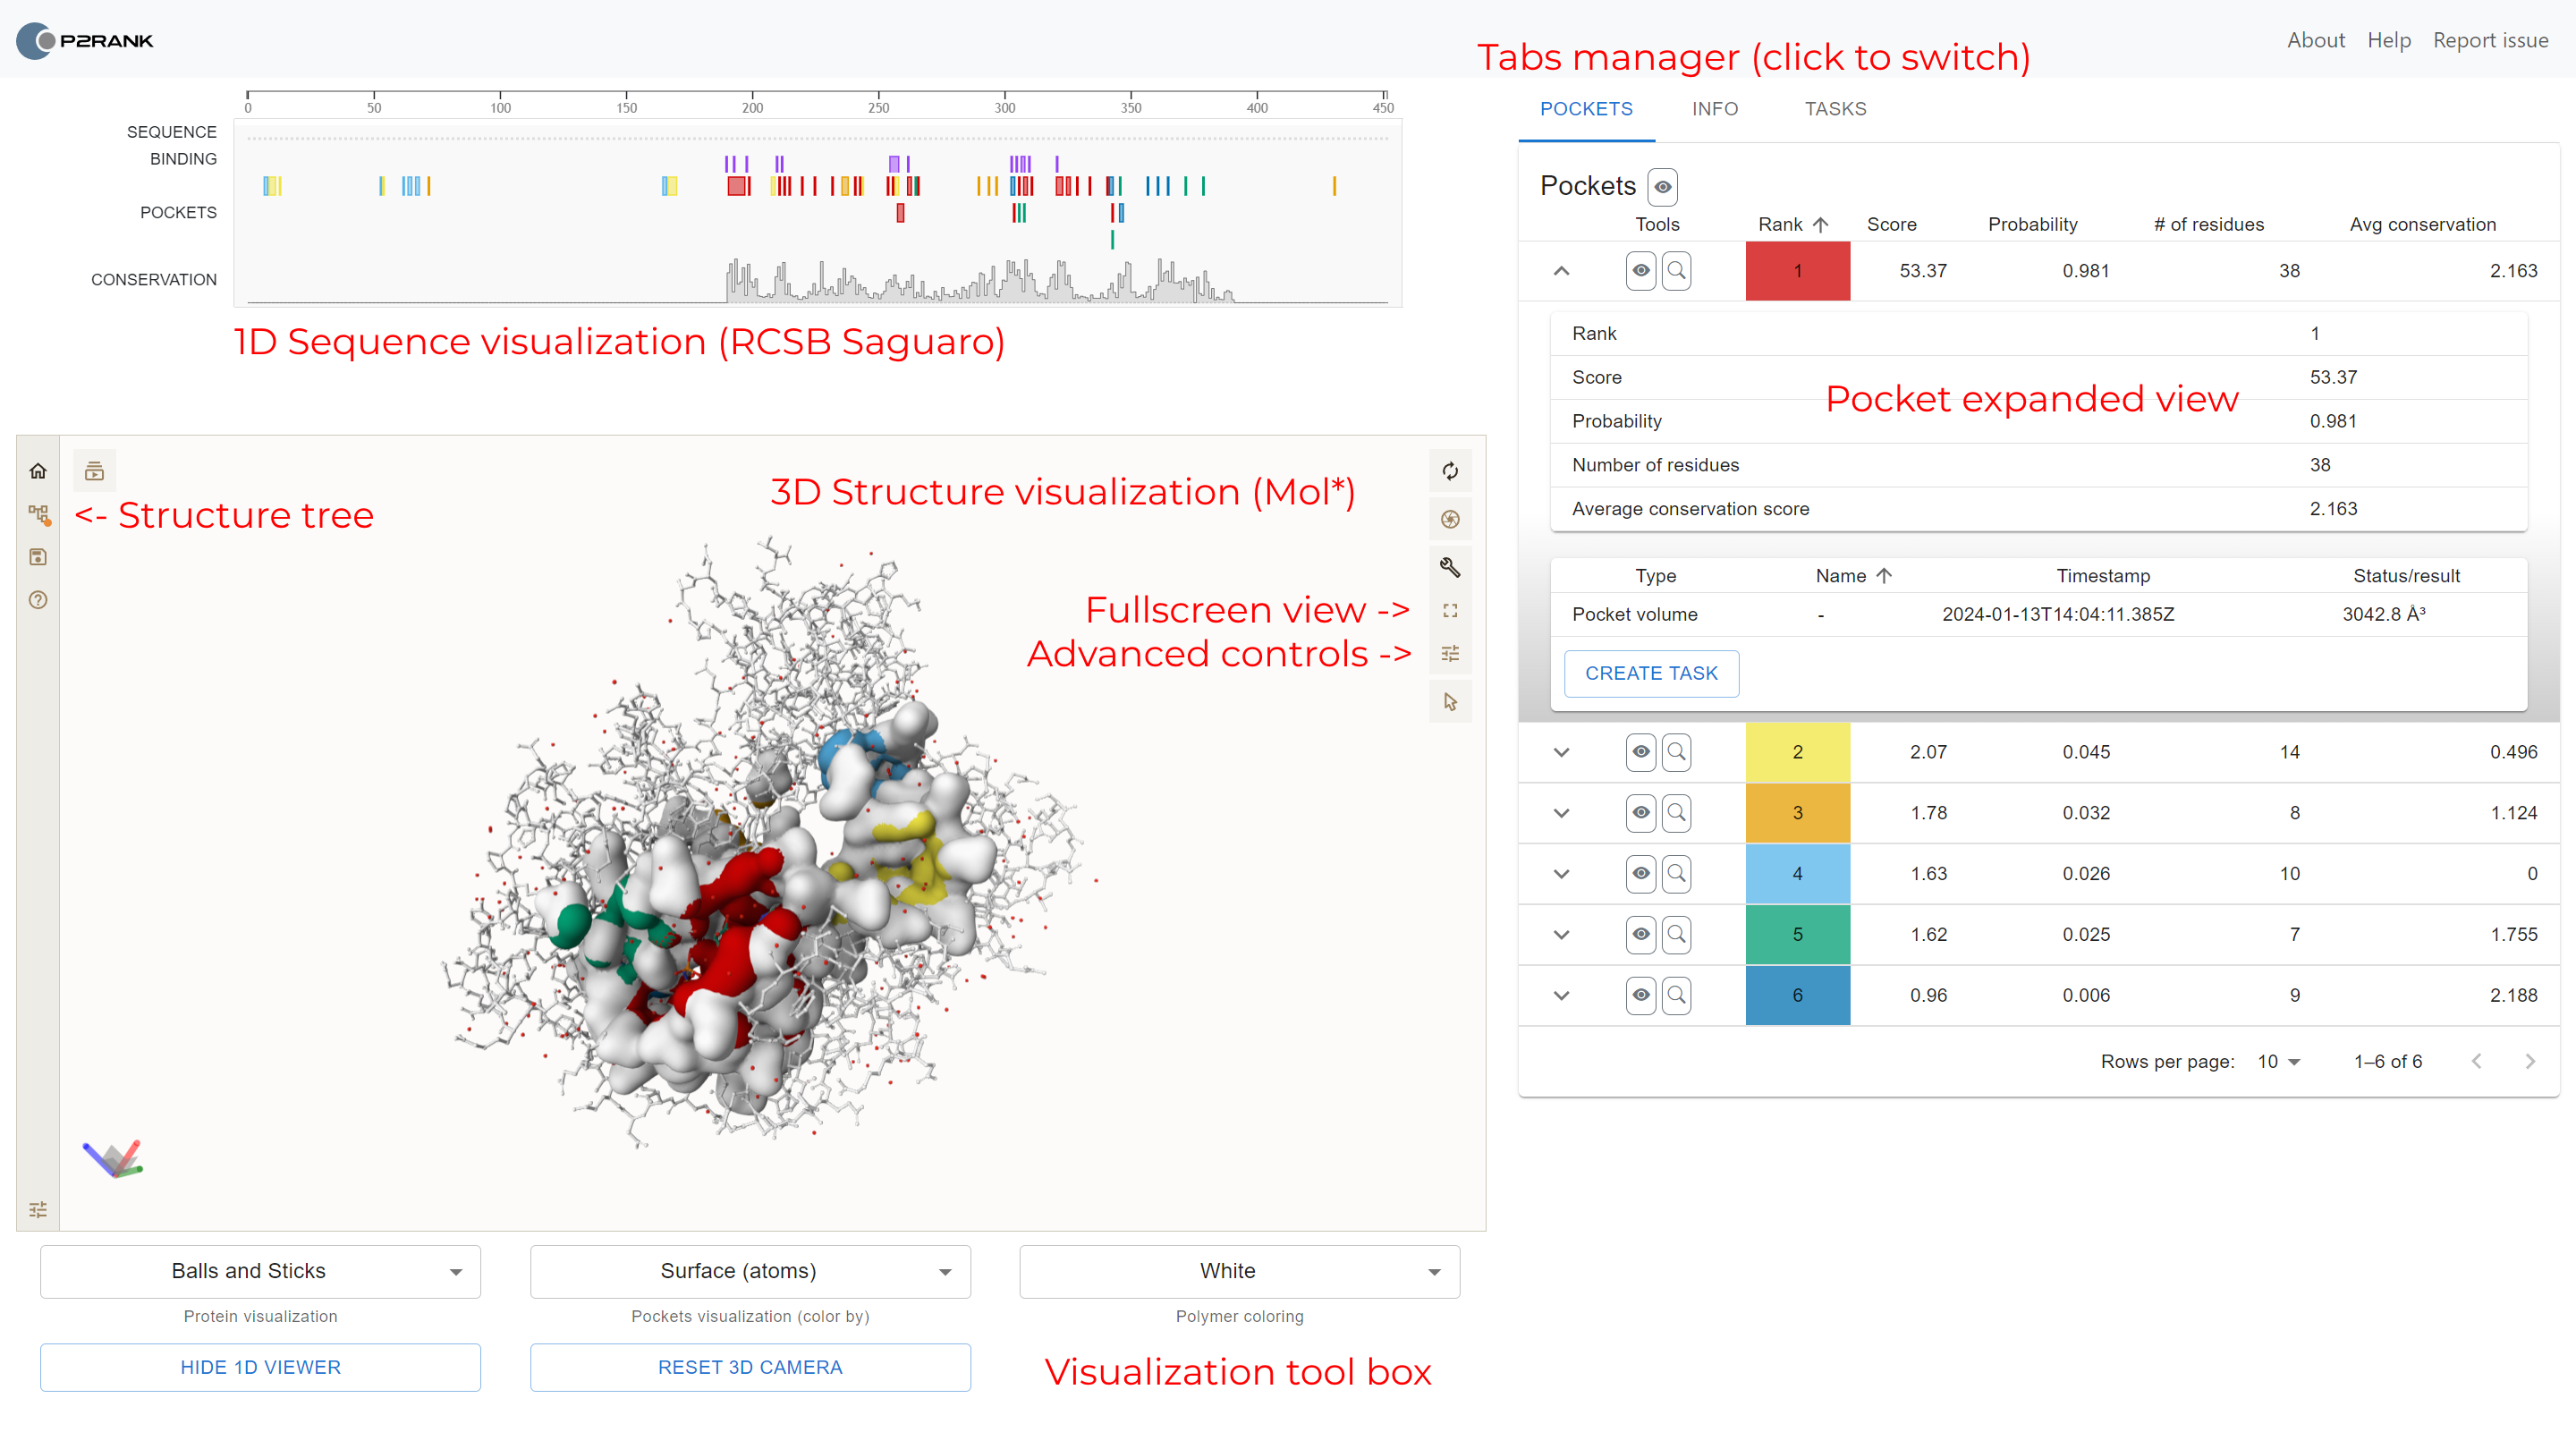
Once the protein visualization is loaded, three main panels appear: sequence visualization, structural visualization and the pocket panel. There are several properties that are displayed in the pocket details panel:
- Rank based on P2Rank score
- Score (P2Rank result)
- Probability of pocket
- Number of pocket residues
- Average conservation/AlphaFold score, if available
The user also may create tasks for each of the pockets. The tasks may be created directly from the tasks tab.
Detailed description
Specify what structure to analyze
There are three options to obtain a structure:
- PrankWeb can download it automatically from PDB database provided the protein identification code.
- A structure file, PDB or mmCif, can be uploaded from user's computer.
- Provided Uniprot ID PrankWeb can download structure from AlphaFold Protein Structure Database. For this option the structure visualization may be colored using residue-level confidence scores.
Conservation
Besides selecting what protein to analyze, one can also specify whether evolutionary conservation should be included in the prediction model by checking the Use conservation checkbox. Note that calculating conservation score can increase the time of analysis.
The new conservation pipeline operates as follows. First, polypeptide chain sequences are extracted from the input file using P2Rank. The phmmer tool from the HMMER software package is then used to identify and align similar sequences for each respective query; UniRef50 Release 2021 03 is used as the single target sequence database. Up to 1,000 sequences are then randomly selected from each MSA to form the respective sample MSAs; weights are assigned to the individual sequences constituting the sample MSAs using the Gerstein/Sonnhammer/Chothia algorithm implemented in the esl-weigh miniapp included with the HMMER software. Finally, per-column information content (i.e., conservation score) and gap character frequency values are calculated using the esl-alistat miniapp, taking the individual sequence weights into account; positions containing the gap character in more than 50% of sequences are masked to appear as possessing no conservation at all.
The range of the conservation corresponds to the range of the per-residue of information content which is between 0 and ~ 4 ( = log2(20) ) with higher values corresponding to higher conservation.
Visualization
Once the protein visualization is loaded, three main panels appear: sequence visualization, structural visualization and the tabs panel.
Structural visualization
The largest panel contains the three-dimensional visualization of the protein.
- By default, the protein surface is displayed, and individual pocket areas are highlighted with different colors. Ligands (if available) are displayed in the ball and stick representation.
- The user may change the coloring of the protein in the tool box on the bottom, under the visualization.
- If a conservation score is available, the protein atoms may be colored with shades of gray according to the score of each residue. Darker color depicts higher score.
- If an AlphaFold score (pLDDT) is available, the protein atoms may be colored with the apropriate color according to the score of each residue. The colors are defined by AlphaFold (blue depicts more confidence).
- To switch between the views of the protein, use Protein visualization and Pockets visualization selections in the visualization tool box.
- The user may reset the camera by clicking the Reset 3D camera button.
- If the visualised structure is predicted, then the tool box also contains a toggle button. Using the button user can toggle between visualization of a whole structure and confidently predicted regions (confidence score > 70).
Controls
The molecule can be rotated by moving mouse while holding left mouse button. On a touch device, just slide your finger. To zoom in or out, use your mouse wheel button or use the pinch gesture on a touch display. In order to move the protein, hold the right mouse button. Lastly, for slabbing the protein, scroll the mouse wheel or use the three finger gesture.
Using the buttons in the top-right corner, one can:
- Reset the camera.
- Create a snapshot of current visualization.
- Toggle the advanced control panel.
- Toggle full-screen mode.
- Setup the scene such as the visualization background or the field of view.
- Toggle the selection mode.
The panel with advanced controls is toggled by default. It is located on the left side of the viewer. Using the buttons, the user is able to:
- Work with the structure and download it.
- Toggle the state tree and thus toggle all of the available representations.
- Save the current plugin state.
- View the help panel.
For more help with Mol*, please visit its official page or the GitHub page.
Sequence visualization
The panel above protein 3D visualization displays protein sequence.
- All chains are concatenated and visualized at once.
- Colored rectangles depict areas with predicted pockets and real binding areas (if available).
- Real binding sites are residues within 4 Å from any ligand atom.
- If available, conservation and AlphaFold scores are portrayed using a bar chart.
- The user may toggle the 1D sequence viewer by clicking the Show/Hide 1D viewer button below the 3D viewer.
As one hovers over the sequence with mouse, the residues are highlighted in the 3D visualization. This feature allows to analyze the protein both from the structural and sequential point of view. By default, the sequence view is zoomed out so that the whole protein is displayed. You can use your mouse to zoom in, or zoom to the selected residue by clicking the responsible area.
Tabs panel
The right panel contains several tabs with three main functionalities: pocket list, structure information and task management panel. First, let's describe the pocket list.
The pocket list is a sortable table containing all details about the individual pockets. Each pocket has its own row in the table. Each row contains the pocket name, rank, probability score, number of pockets, average conservation score (if available) and average AlphaFold score (if available). The table can be sorted by clicking on the column names. It is also possible to show/hide individual pockets by clicking on the eye icon and also to focus on the pocket by clicking on the magnifying glass icon. The pocket may also be expanded by clicking on the caret icon. This expanded view shows additional information about the pocket, and also shows all computed tasks for the pocket (and allows to compute a new one).
The structure information tab contains information about the protein structure. It shows the prediction name, structure ID, database, creation time and used P2Rank version, if available. The user may also download the prediction data here.
The task management panel allows the user to create and view tasks for the pockets. The user may create a new task by specifying the task type, name and parameters (e.g. for docking task, the user may specify the ligand to dock in SMILES format). Then, the task status is displayed in the table. The user may also view the results of the task by clicking on the pocket details in the expanded view (see the pocket list).
Probability score calculation
The transformer that calculates probability scores from raw scores is calibrated for each individual model (Default, Default+Conservation, Alphafold, Alphafold+Conservation) on the calibration dataset (HOLO4K). The probability score P(x) for a given raw score x is calculated the following way: P(x) = Tx / (Tx + Fx) where Tx is the number of true pockets with a raw score ≤x and Fx is the number for false pockets with the score ≥x (both refer to the predictions of a particular model on the calibration dataset).
Contact us
Something is not working or are you missing certain functionality/feature? Please let us know by creating a GitHub issue. Alternatively, if you prefer to use email, please feel free to reach us at david.hoksza (at) matfyz.cuni.cz.
PrankWeb is a part of services provided by ELIXIR – European research infrastructure for biological information.
See services provided by ELIXIR's Czech Republic Node.
© PrankWeb, Charles University 2017-